Deep Freeze Grips Illinois, Wisconsin, Michigan, Ohio, Pennsylvania and New York as Early February Cold Runs 10–20°F Below Normal
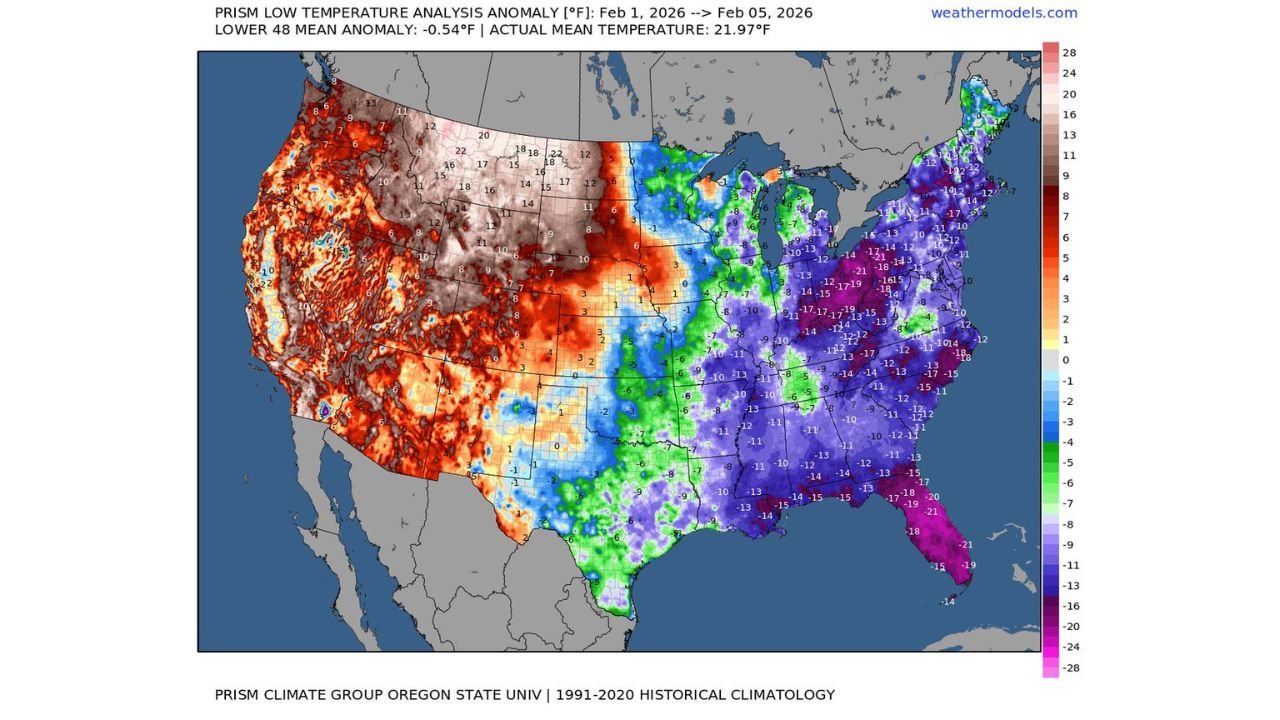
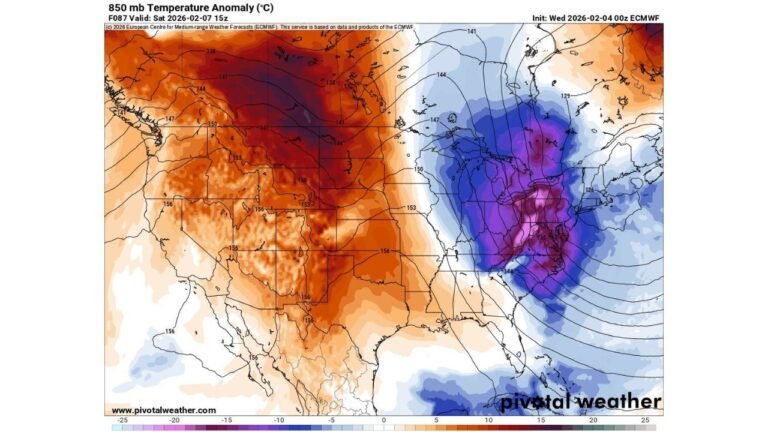
UNITED STATES — Early February 2026 has delivered one of the sharpest cold snaps of the winter across the Central and Eastern United States, with temperature anomaly data showing widespread readings 10 to 20 degrees colder than normal from the Midwest through the Northeast. At the same time, much of the Western United States remains warmer than average, creating a dramatic coast-to-coast temperature contrast.
The data, covering February 1 through February 5, highlights just how unusually persistent and widespread this cold pattern has been — especially east of the Mississippi River.
Midwest Takes the Brunt: Illinois, Wisconsin, Michigan Well Below Average
Across the Upper Midwest, the cold anomaly map shows a large swath of deep purple and blue shading, indicating temperatures running 10–15°F below normal, with pockets even colder.
- Illinois experienced sustained below-average temperatures statewide, including the Chicago metro area, where cold air remained locked in rather than moderating.
- Wisconsin and Michigan saw some of the most consistent departures from normal, with prolonged cold keeping daytime highs suppressed and nighttime lows biting.
- The persistence — not just intensity — made this stretch especially noticeable, as cold air failed to retreat between systems.
This pattern aligns with repeated Arctic intrusions rather than a single passing cold front.
Ohio Valley and Great Lakes: Cold Air Refuses to Budge
Moving east into Indiana, Ohio, and the Great Lakes region, anomalies remain firmly negative.
- Much of Ohio shows temperatures 12–18°F below normal, especially across northern and central sections.
- Cold air pooled efficiently in valleys and low-lying areas, reinforcing overnight lows well below seasonal expectations.
- Lake-influenced moderation was limited, as cold air dominated even near shorelines.
This helped extend winter-like conditions deeper into February than many areas typically see.
Northeast Corridor Hit Hard: Pennsylvania, New York, New England Stand Out
The most striking anomalies appear across the Northeast, particularly from Pennsylvania through New York and into New England.
- Pennsylvania and New York show some of the coldest departures on the map, with widespread 15–20°F below-normal readings.
- Interior New York and parts of New England were among the coldest relative to climatology.
- Even major urban corridors failed to escape the chill, reinforcing the sense that winter “overperformed” compared to expectations.
This pattern explains why the cold felt especially harsh despite mid-winter averages already being low.
Southeast Also Affected: Cold Reaches the Deep South
Unusually, the cold anomaly pushed well into the Southeastern U.S.:
- Kentucky, Tennessee, Alabama, Georgia, and Florida all registered colder-than-normal conditions.
- Florida, particularly the peninsula, stands out with anomalies approaching 15–20°F below normal, a significant deviation for early February.
- This southward reach highlights the strength and depth of the Arctic air mass.
Cold reaching this far south is a clear signal of a highly amplified winter pattern.
West Runs Warm: Sharp National Temperature Contrast
While the East froze, the Western United States told a completely different story.
- California, the Pacific Northwest, and much of the Southwest experienced above-average temperatures.
- Reds and oranges dominate the West on the anomaly map, showing a sustained warm pattern.
- This contrast intensified the jet stream gradient, helping keep cold air locked in place farther east.
Such sharp east-west contrasts often signal a blocked atmospheric pattern rather than transient weather.
Why This Cold Stretch Felt Different
Several factors made this cold stand out:
- Duration: Cold anomalies persisted for days, not hours.
- Coverage: Affected nearly the entire Central and Eastern U.S.
- Depth: Anomalies reached well into the Deep South.
- Contrast: Warm West vs. cold East amplified the perception of extremes.
Even though the Lower 48 mean anomaly hovered near average overall, regional impacts were anything but average.
What It Means Going Forward
With snowpack building in some regions and soil temperatures dropping, this cold stretch could influence:
- Late-winter storm efficiency
- Spring temperature swings
- Energy demand and infrastructure stress
Winter made its presence very clear during this early February window — especially east of the Rockies.
If you felt this cold where you live, you weren’t imagining it.
Was your area closer to the deep-freeze zones, or did you dodge the worst of it?
Share your experience and keep following ChicagoMusicGuide.com for weather stories that actually explain what’s happening — not just the numbers.