A Massive Moisture Pipeline Is Now Connecting the Atlantic Ocean to the Gulf Coast and Midwest With Up to 6 Inches of Rainfall Possible Across Missouri, Illinois, Indiana and Ohio Through April 5
NEW ORLEANS, LA — The eastern United States is about to get soaked — and the satellite imagery captured Sunday morning shows exactly why. A broad area of Atlantic moisture is visibly shifting westward from the central Atlantic into the southwestern Atlantic, where it is linking up with a developing onshore flow pattern along Florida’s east coast and feeding directly into a rainfall corridor that stretches from the Gulf Coast all the way through the Midwest and into the Northeast. The NOAA Weather Prediction Center’s 7-day total precipitation forecast is now showing peak accumulations of 6.14 inches across portions of the central United States through April 5 — and the map making that forecast is one of the most impactful precipitation outlooks seen this early in the spring season.
What the Satellite Is Showing Right Now
The GOES-19 true color and shortwave infrared satellite image captured at 18:45z on March 29, 2026 tells a detailed story about how this moisture pattern is physically assembling itself across the Atlantic and Gulf region.
The green circled moisture mass on the satellite image — positioned in the southwestern Atlantic roughly between Florida and the mid-Atlantic Ocean — represents the deep tropical and subtropical moisture that is now being drawn westward toward the U.S. coastline. The red arrows on the image show the direction of flow — that moisture is tracking directly toward Florida’s east coast and then curving northward along the Eastern Seaboard toward the Mid-Atlantic.
Simultaneously, a high pressure system — marked with the blue “H” over the central Appalachians — is helping direct the flow. High pressure systems rotate clockwise in the Northern Hemisphere, meaning the southern side of this high is pulling Gulf of Mexico moisture northward across the southeastern United States while the eastern side is drawing Atlantic moisture westward toward the Florida coast.
The gray curved arrows along the Gulf Coast show the broader circulation pattern that is routing Gulf moisture northward from Mexico and the western Gulf into the Mississippi Valley and lower Midwest. Two separate moisture sources — the Atlantic and the Gulf of Mexico — are both contributing to the same rainfall event across the eastern United States. That dual-sourced moisture supply is what makes the precipitation totals on the WPC map so significant.
What the 7-Day Rainfall Map Is Showing
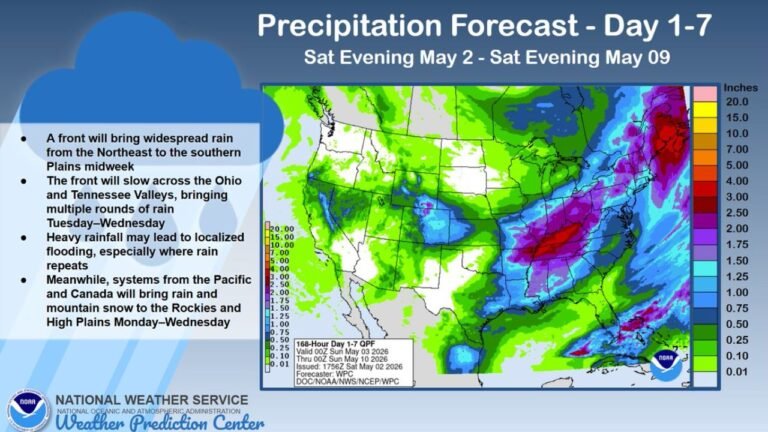
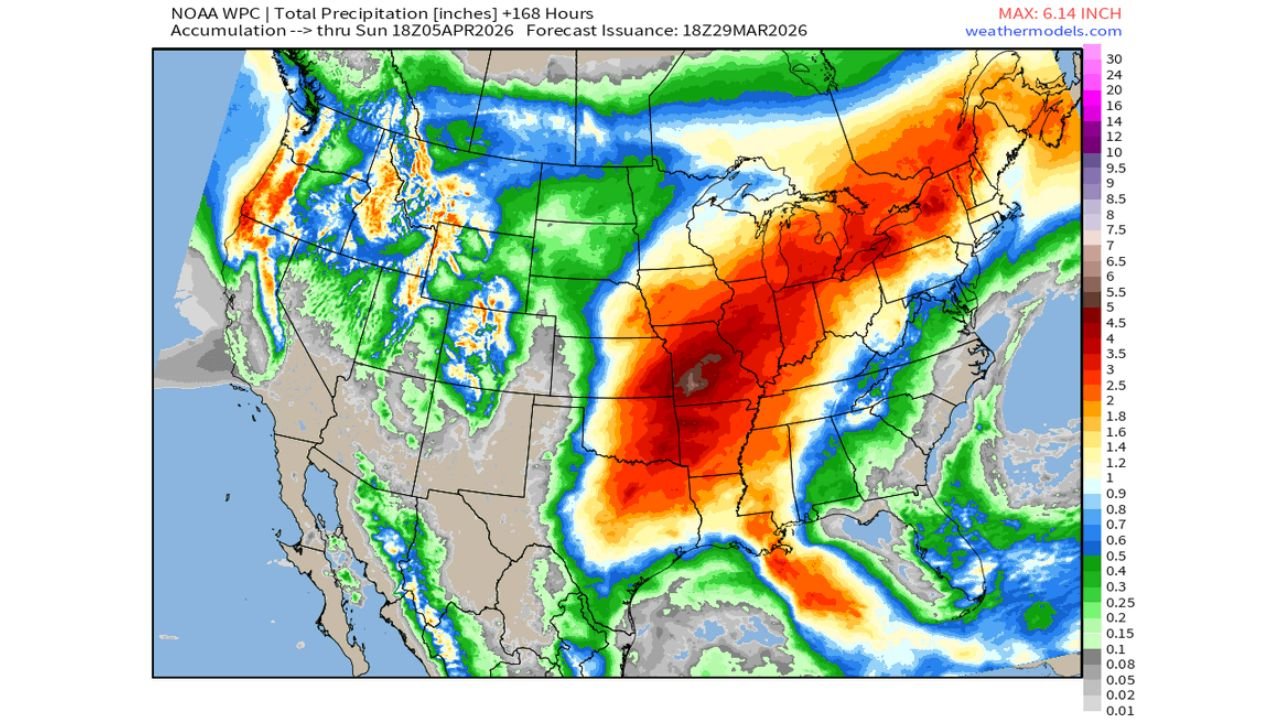
The NOAA Weather Prediction Center total precipitation forecast, issued 18z March 29, 2026, valid through 18z April 5, 2026, is one of the most striking national precipitation maps of the early spring season. The deep red and orange colors dominating the central and eastern United States represent historically above-normal 7-day rainfall totals for this time of year.
Maximum value on the map: 6.14 inches — located in the core of the heaviest precipitation zone across the lower Midwest and mid-South.
Breaking down the rainfall forecast by zone:
The deep red core — representing the heaviest expected accumulations — is centered over Missouri, southern Illinois, Indiana, western Kentucky and into northern Arkansas and Tennessee. This zone is forecast to receive 4.5 to 6+ inches of total precipitation through April 5. For context, the average April total rainfall for much of this region is 3 to 5 inches for the entire month. The current 7-day forecast is potentially delivering a full month of April rainfall in a single week.
The orange zone extending northeast from the red core covers Ohio, Michigan, western Pennsylvania and into New York and New England — with forecast totals of 3.5 to 5.5 inches across this corridor. The Great Lakes region, already dealing with saturated soils from repeated March storm systems, is facing another significant rainfall event on top of an already wet foundation.
The red and orange zone extending southeast from the core covers Tennessee, Mississippi, Alabama and into the Florida Panhandle — with totals of 3.5 to 5 inches forecast across much of this region. Combined with the existing onshore flow from the Atlantic feeding Florida’s east coast, the Southeast faces a persistently wet pattern through the entire week.
The Pacific Northwest is showing its own separate heavy precipitation signal — with red and orange totals of 4.5 to 6+ inches forecast across western Washington, Oregon and northern California, separate from the eastern moisture event and driven by a different Pacific storm system.
Why This Pattern Is More Connected Than It Looks
The satellite image and the precipitation map together tell a unified story — and the connection between them is the key to understanding why this rainfall event is so widespread.
The Atlantic moisture being drawn westward toward Florida is not staying in Florida. It is feeding into the broader onshore flow pattern that routes Gulf and Atlantic moisture northward through the Mississippi Valley. The well-defined corridor of heavier rainfall from the Gulf Coast through the Midwest and into the Northeast visible on the WPC map is the downstream result of that Atlantic moisture connection combining with Gulf moisture already streaming northward through the system.
This is what meteorologists call a moisture-rich pattern — an atmospheric configuration where multiple moisture sources are simultaneously contributing to precipitation over the same broad region. When the Atlantic, the Gulf and the Pacific are all simultaneously active contributors to U.S. rainfall patterns, the result is exactly the kind of map the WPC is now showing — heavy precipitation across a vast geographic area with multiple localized maxima.
7-Day Rainfall Forecast Summary Table
| Region | Forecast Totals | Normal April Monthly Total | Flooding Concern |
|---|---|---|---|
| Missouri, S. Illinois, Indiana | 4.5 to 6.14 inches | 3.5 to 4.5 inches | 🔴 High |
| Ohio, Michigan, W. Pennsylvania | 3.5 to 5.5 inches | 3.0 to 4.0 inches | 🔴 High |
| Tennessee, Alabama, Mississippi | 3.5 to 5.0 inches | 4.0 to 5.0 inches | 🟠 Moderate-High |
| Florida East Coast and Southeast | 1.5 to 3.0 inches | 3.0 to 4.0 inches | 🟡 Moderate |
| Gulf Coast — Louisiana, Texas | 1.5 to 2.5 inches | 3.5 to 4.5 inches | 🟡 Moderate |
| Pacific Northwest — WA, OR, N. CA | 4.5 to 6.0+ inches | 3.0 to 5.0 inches | 🔴 High |
| Overall Forecast Confidence | NOAA WPC Official | 7-day valid through 4/5 | 🟠 Moderate-High |
State-by-State Impact
🔴 Missouri — Sitting in the deepest part of the red precipitation core. The St. Louis metro, Kansas City and the Missouri Bootheel are all forecast to receive among the heaviest rainfall totals in the entire country over the next seven days. River flooding along the Missouri and Mississippi river systems is a primary concern with these totals.
🔴 Illinois — Southern Illinois falls inside the 4.5 to 6+ inch zone. Carbondale, Mt. Vernon and the Metro East area across from St. Louis face the highest rainfall accumulations in the state. Central Illinois from Springfield south is also in the heavy rainfall corridor.
🔴 Indiana — The entire state is inside the heavy precipitation zone with the southern half seeing the most significant totals. Evansville, Terre Haute and Indianapolis all face rainfall accumulations that will stress river systems and increase flash flood risk through the week.
🔴 Ohio — Cincinnati, Columbus and Dayton fall inside the orange to red precipitation zone. With soils already saturated from repeated March storm systems, additional rainfall totals of 3.5 to 5+ inches represent a significant flooding threat for the Ohio River corridor.
🔴 Michigan — The Detroit metro, Grand Rapids and Lansing are in the orange zone with 3.5 to 5 inches forecast. Great Lakes water levels and already-saturated soils across Lower Michigan make flooding impacts possible even at the lower end of the forecast range.
🟠 Tennessee and Kentucky — Both states fall inside the heavy rainfall envelope. The Nashville corridor and the Cumberland River watershed face significant accumulations through April 5. Kentucky’s river systems — already running elevated from earlier March rainfall — will be closely monitored.
🟠 Florida East Coast — Jacksonville through Miami — The onshore flow connection from the Atlantic moisture shown on the satellite is delivering enhanced rainfall to Florida’s east coast. While totals are lower than the Midwest core, the persistent onshore flow pattern keeps rain chances elevated throughout the week.
🟠 Pacific Northwest — Washington and Oregon — A separate but equally significant heavy precipitation event is unfolding across the Pacific Northwest with 4.5 to 6+ inch totals forecast across the mountain ranges and coastal ranges of western Washington, Oregon and northern California. Snowpack and river impacts are separate concerns for this region.
The Flooding Risk That Cannot Be Ignored
The most critical context for this 7-day rainfall forecast is what is already on the ground across much of the Midwest and Southeast. March 2026 has been an exceptionally active month for precipitation across the Ohio Valley, Tennessee Valley and Mississippi River corridor. Soils across much of Indiana, Ohio, Kentucky and Tennessee are already at or near saturation from multiple storm systems that moved through the region throughout March.
When saturated soils receive an additional 4 to 6 inches of rainfall over 7 days, the runoff response is dramatically faster and more severe than it would be on dry ground. Rivers rise more quickly, flash flooding develops with less total rainfall required, and the flooding impacts persist longer because the soil cannot absorb any additional moisture.
Anyone living near a river, creek or historically flood-prone area across Missouri, Illinois, Indiana, Ohio or Kentucky should be monitoring their local NWS forecast office daily through April 5 and should have a clear plan for how they will respond if flooding threatens their property.
One of the Wettest Weeks of the Spring Season Is Now Underway Across the Eastern United States
The moisture is in place, the pattern is locked in and the rainfall totals are going to be significant. Stay informed at ChicagoMusicGuide.com — your source for breaking rainfall forecasts, flood risk analysis and precipitation tracking across Missouri, Illinois, Indiana, Ohio and the entire United States.