
Illinois and Ohio Emerge as Major Speeding Ticket Hotspots as Map Highlights Heavy Enforcement Across Midwest and Southeast
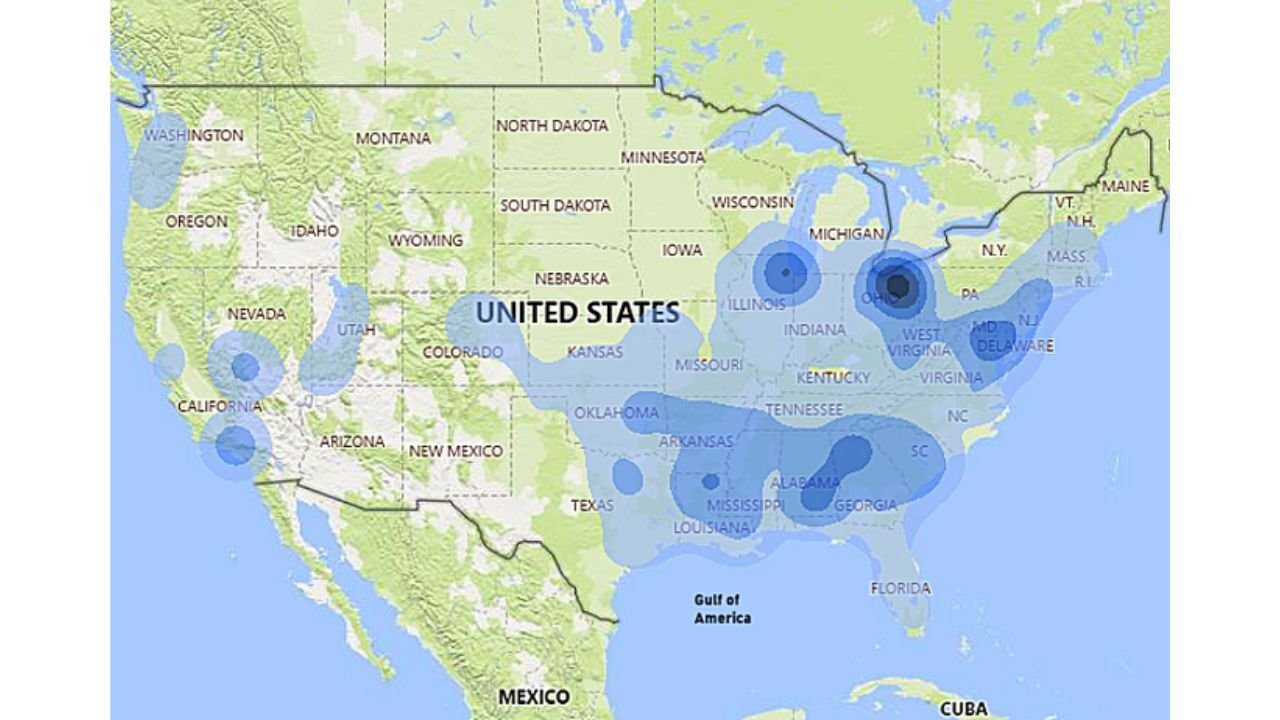
UNITED STATES — A nationwide heat map identifying where drivers are most likely to receive a speeding ticket shows pronounced hotspots across Illinois, Ohio and several Southeastern states, with the Midwest standing out as a key enforcement corridor.
The shaded concentration zones indicate clusters of higher ticket likelihood, with darker areas representing stronger enforcement or higher citation frequency.
Midwest Stands Out With Illinois and Ohio Centers
Two of the most intense clusters appear in:
- Illinois
- Ohio
The Illinois hotspot is centered near the Chicago region and extends across northern parts of the state. Meanwhile, Ohio displays one of the darkest concentrations on the map, suggesting a particularly high likelihood of enforcement in central portions of the state.
Indiana and surrounding Midwest states also show broader shaded areas, indicating elevated enforcement across the region.
Broad Enforcement Across the Southeast
Beyond the Midwest, the map reveals a large swath of elevated ticket risk stretching through:
- West Virginia
- Virginia
- Maryland
- Delaware
- Kentucky
- Tennessee
- Alabama
- Georgia
- Mississippi
- Louisiana
The Southeast appears covered by a widespread light-to-moderate shading, suggesting consistent enforcement rather than isolated hotspots.
Georgia and Alabama show noticeable clusters, while Mississippi and Louisiana reflect broader coverage.
Southern Plains and Texas Also Included
Parts of:
- Oklahoma
- Arkansas
- Texas
also fall within moderate ticket-probability zones. Texas displays multiple clusters rather than one concentrated center.
Western States Show Scattered Clusters
In the western United States, enforcement appears more scattered compared to the dense Midwest and Southeast coverage.
Notable clusters appear in:
- California
- Nevada
- Utah
- Parts of the Pacific Northwest including Washington
However, the western hotspots are more isolated and not as broadly continuous as those seen east of the Mississippi River.
What the Pattern Suggests
The map illustrates a clear divide:
- Heavier, more continuous enforcement zones across Illinois, Ohio and the Southeast
- More isolated, urban-based clusters in the West
For drivers traveling through Chicago, central Ohio, or the Mid-Atlantic corridor, the data suggests heightened vigilance may be warranted.
While exact reasons behind enforcement intensity are not detailed in the map, the visual pattern highlights where speeding citations are most concentrated nationwide.
ChicagoMusicGuide.com will continue monitoring traffic trends and enforcement patterns across key U.S. corridors.