
NOAA Launches New Severe Hazards Data Viewer Tracking 30 Years of Storm Risk Across Texas, Oklahoma, Florida, and the Southeast
UNITED STATES — The National Weather Service’s Storm Prediction Center (SPC) has launched a new Severe Hazards Data Viewer, giving the public, researchers, and emergency planners access to 30 years of historical data on severe storms, wildfires, and lightning across the continental United States. The interactive platform allows users to visualize long-term hazard trends through a customizable, map-based interface.
A New Tool Built With Research and Forecasting in Mind
Developed in collaboration with SPC and CIWRO research scientists, the Severe Hazards Data Viewer is designed to bridge the gap between raw climatology data and real-world decision-making. The tool consolidates decades of verified storm reports into a single, easy-to-navigate dashboard.
Users can explore daily and seasonal probabilities of severe thunderstorms, including tornadoes, damaging winds, and large hail, while also examining historical patterns of wildfire occurrence and lightning frequency. The goal is to provide both context and clarity about how often hazardous weather has occurred in specific regions over time.
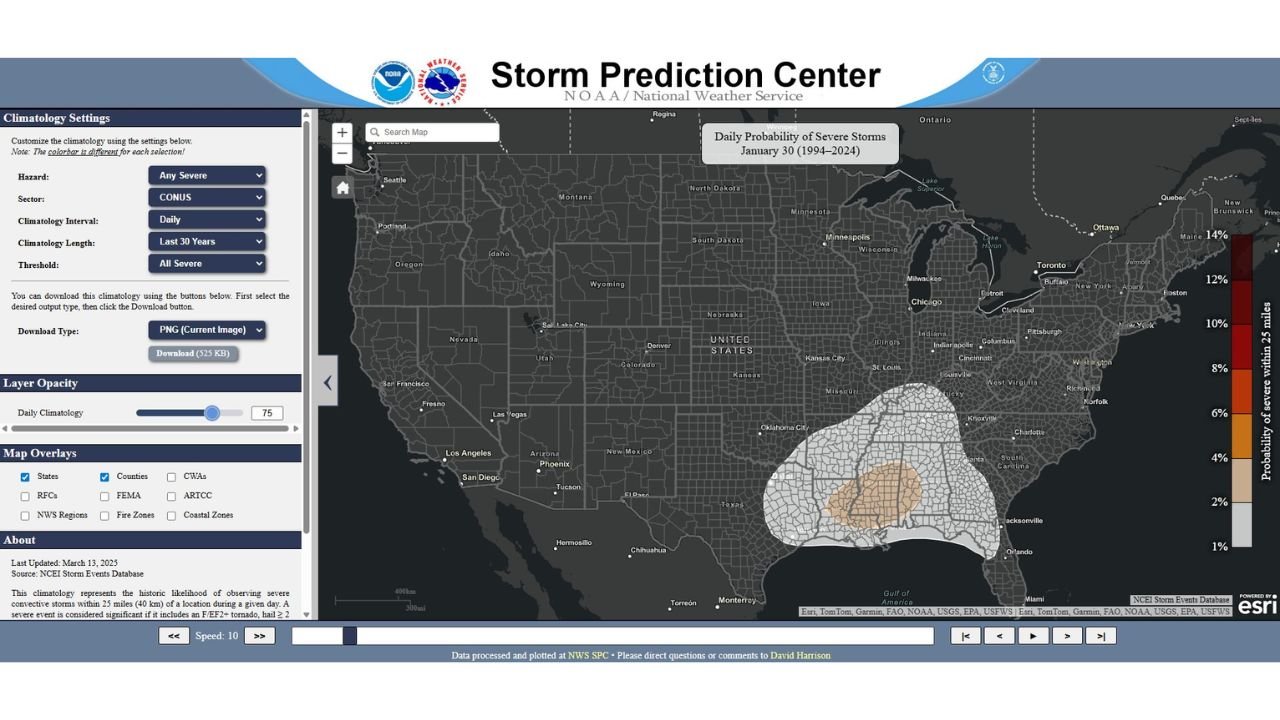
Interactive Mapping Shows Long-Term Severe Weather Patterns
One of the most striking features of the viewer is its interactive national map, which displays probabilities based on a 30-year climatology. For example, the daily severe storm probability layer highlights a familiar corridor stretching across parts of the Gulf Coast and Southeast, where severe weather has historically been most frequent during certain times of the year.
The map allows users to zoom from a national view down to county-level detail, making it easier to identify localized risk patterns. Layer controls enable users to toggle between hazards, adjust opacity, and overlay geographic boundaries such as states and counties.
Customizable Filters Add Depth and Precision
The Severe Hazards Data Viewer offers a wide range of customization options, including:
- Hazard selection (any severe weather, specific storm types, wildfire, or lightning)
- Time scale adjustments, from daily probabilities to broader climatological periods
- Sector selection, focusing on the contiguous United States
- Download options, allowing users to export images for reports or presentations
These features make the tool valuable not just for meteorologists, but also for emergency managers, educators, media outlets, and weather-aware industries that rely on long-term risk assessment.
Why This Viewer Matters Beyond Daily Forecasts
While daily forecasts focus on what may happen in the next few hours or days, climatology tools like this provide insight into what typically happens over decades. This context is critical for understanding seasonal risk, planning infrastructure, and improving public preparedness.
By showing how frequently severe weather has occurred in the past, the viewer helps explain why certain regions are more prone to specific hazards — and why heightened awareness is necessary even outside active storm periods.
Designed for Transparency and Public Access
The SPC emphasizes that the Severe Hazards Data Viewer is publicly accessible and built on verified historical datasets. The platform reflects ongoing efforts within NOAA to improve transparency, data literacy, and public engagement with weather science.
Officials note that while the viewer does not replace real-time forecasts or watches and warnings, it serves as a powerful educational and planning resource that complements operational forecasting.
As severe weather threats continue to impact communities nationwide, tools like this provide a clearer picture of long-term risk and help put individual weather events into historical perspective. For continued updates on major weather developments, forecasting tools, and climate-related insights, visit ChicagoMusicGuide.com.