
Ohio, Kentucky, West Virginia, Pennsylvania, and New York Pop Up in Extreme Late-January Snow Run That Forecasters Say Is “Off the Charts”
COLUMBUS, OHIO — A new long-range GFS model run is turning heads across the Ohio Valley and into the Northeast, showing a dramatic swath of potential snowfall stretching from parts of Ohio and Kentucky through West Virginia, Pennsylvania, and into New York by Thursday, Jan. 29, 2026. The reason it’s getting attention isn’t because it’s a confirmed forecast—it’s because the simulated totals shown on the maps look unusually large for such a wide area, even by typical winter “fantasy range” standards.
This kind of output is best treated as a signal, not a promise. At roughly two weeks out, models can swing hard run-to-run, and small shifts in storm track, temperature profiles, and timing can completely reshape who sees heavy snow, mixed precipitation, or mainly rain.
What The Maps Are Showing: A Broad Snow Swath From The Midwest Into The Northeast
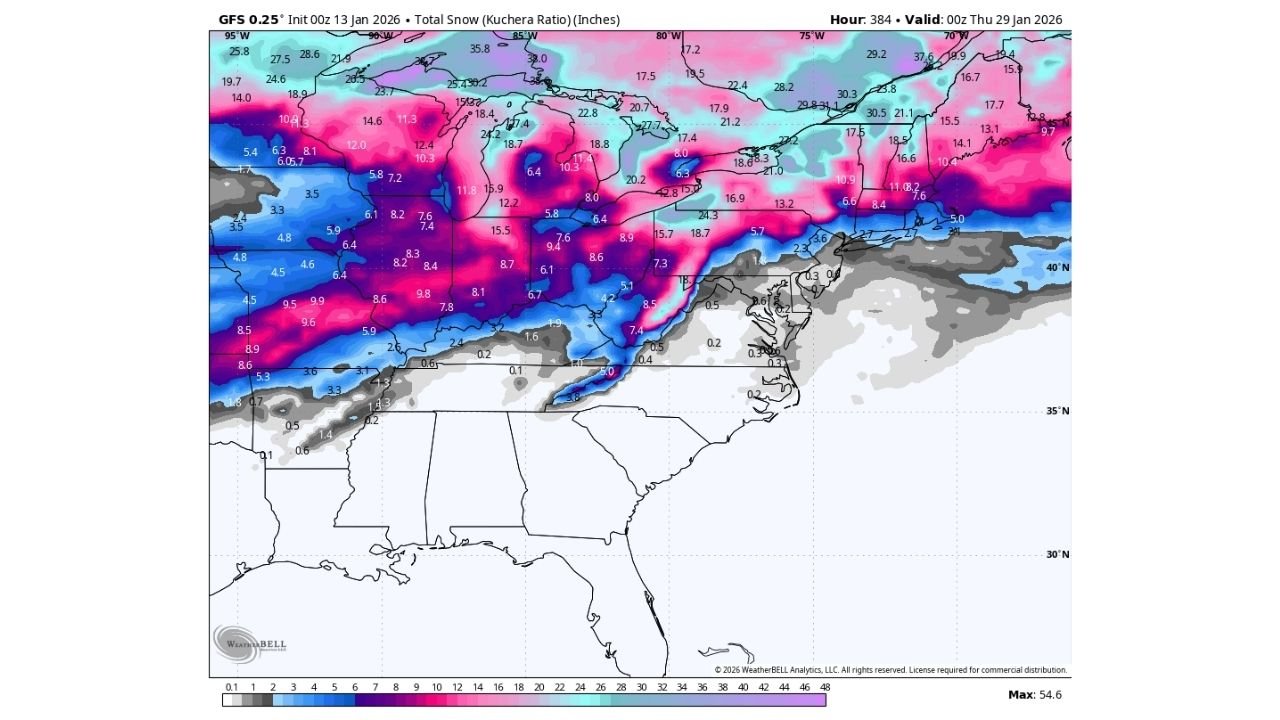
The total snow (Kuchera ratio) maps show a thick band of heavier snow potential arcing from the Midwest/Great Lakes region into the interior Northeast. In this specific run, the higher totals appear to include parts of Ohio, Indiana, Michigan, Kentucky, and West Virginia, then continue through Pennsylvania and into New York—with snow also extending toward the broader Northeast beyond that core corridor.
One detail that jumps out in the graphics: the snow footprint isn’t just a narrow stripe. It’s a wide, organized swath that implies a major, well-phased storm system. That’s exactly the type of “big picture” look meteorologists watch for at long range—because if that pattern persists in future runs (and is supported by other models), it can be an early clue that the atmosphere may be building toward a meaningful winter setup.
At the same time, the same maps show sharp gradients south of the main band, suggesting that storm track and cold air placement would be everything. A shift north or south could move the heavy snow axis by an entire state—changing outcomes for places like Cincinnati, Charleston, Pittsburgh, Harrisburg, and Buffalo in very different ways.
Why This Is Getting Shared: The “Never Seen This Much Snow” Reaction
The text alongside the images captures the mood: the poster says they’ve “never seen a GFS run with this much snow from the Ohio Valley” and notes that less than 24 hours earlier, the model looked different. That’s not unusual in the extended range—especially when the atmosphere is in a pattern that allows storms to amplify quickly.
This is also why forecasters often emphasize that the GFS at long lead times can be both exciting and misleading. A single run can over-amplify a storm, overproduce precipitation, or mis-handle thermal boundaries. When that happens, snowfall maps can explode with extreme totals that don’t verify. But when multiple runs and multiple modeling systems begin clustering around a similar idea, that’s when confidence starts to build.
In other words: the “wow” factor is real—but the reliability is still low at this distance. The best use of a run like this is to monitor whether the signal (storm potential + cold air access) stays alive, not to lock in totals.
Where The Potential Impacts Would Matter Most: Travel, Venues, and Weekend Logistics
If a storm with even a fraction of this footprint became real, the biggest challenges would come from travel disruptions across major corridors—especially those that connect Midwestern and East Coast tour stops. Areas frequently impacted in this type of setup include:
- Interstates running through Ohio and Pennsylvania
- Mountain routes in West Virginia and western Virginia
- Great Lakes-adjacent travel in Michigan and western New York
- Metro connectors in the Mid-Atlantic and Northeast that can snarl quickly under heavy snow
For music fans, the timing matters as much as totals. A late-January storm threat can affect tour routing, overnight bus travel, and flight schedules for weekend shows. Even if you’re not in the bullseye, ripple effects can include delays, rescheduled arrival times for crews, or last-minute changes for events that rely on tight logistics.
The smart planning move right now is simple: treat this as an early heads-up that the pattern may be capable of producing a bigger storm window late in the month—then wait for the shorter-range guidance to decide what’s actually on the table for your city.
What To Watch Next: The Signs This Could Become More Than Just A Wild Model Run
Over the next few days, there are three practical “tell” points that will decide whether this becomes a real story:
- Consistency: Do future GFS runs keep a similar storm track and snow corridor, or does it vanish?
- Model agreement: Do other major models and ensembles begin supporting a similar setup?
- Cold air supply: Does the broader pattern maintain enough cold air across the Ohio Valley and Mid-Atlantic to support snow rather than rain?
If the answers start leaning “yes,” the conversation shifts from internet snow maps to legitimate forecast planning. If the answers stay “no,” this likely ends up as another example of long-range model drama that never materializes.
For now, it’s worth watching—especially for Ohio, Kentucky, West Virginia, Pennsylvania, and New York—but it’s not time to lock in numbers or make major changes to plans yet.
For more weather updates that help you plan travel and live events as winter patterns evolve, keep checking ChicagoMusicGuide.com for the latest coverage.