
Texas, Oklahoma, Kansas, Missouri, Illinois, Indiana and Ohio Under Watch as Early April Trough Signals Potential Severe Weather Risk Across Central and Eastern United States
KANSAS CITY, MO — The first week of April is shaping up to be one of the most meteorologically active stretches the central United States has seen to open a spring season in years — and the atmosphere is not done building its case. Beyond the April 3rd setup already being watched closely across Kansas and Oklahoma, the latest upper-level model data is now flagging another potential severe weather window around April 5th. The catch? The three models currently being analyzed are telling three noticeably different stories about where that energy sets up — and that disagreement is the most important thing to understand about this forecast right now.
What the Upper-Level Data Is Showing for April 5th
The 500 mb height pattern is the atmospheric playing field that determines where storm systems develop, where severe weather corridors set up and how organized the jet stream energy becomes. At 500 mb — roughly 18,000 feet above the surface — the wind flow pattern acts like a steering mechanism for everything happening at ground level below it.
Three separate model solutions have been analyzed for Sunday, April 5th, all valid at the same time — 00z April 5, 2026. Each one is initialized from March 28th data but uses different modeling approaches. The result is a picture of genuine atmospheric uncertainty at this forecast range — and that uncertainty has real implications for anyone trying to pin down exactly which states face the highest severe weather risk around April 5th.
Breaking Down Each Model Solution
ECMWF AIFS Ensemble Mean — The Most Progressive Solution
The ECMWF AI Forecast System ensemble mean, initialized 00z March 28, shows the most amplified and progressive trough pattern of the three solutions for April 5th. The 500 mb height contours on this map are tightly packed across the central United States, with the magenta and purple shading indicating the strongest upper-level wind energy positioned over the Midwest and Great Lakes corridor by April 5th.
This solution suggests the trough has already ejected well northeast by Sunday, placing the primary energy axis over the Ohio Valley and Great Lakes region rather than remaining over the Plains. If this solution verifies, the severe weather window for the central Plains would likely occur before April 5th — with Sunday potentially being a post-frontal pattern with diminishing severe weather potential across the southern Plains.
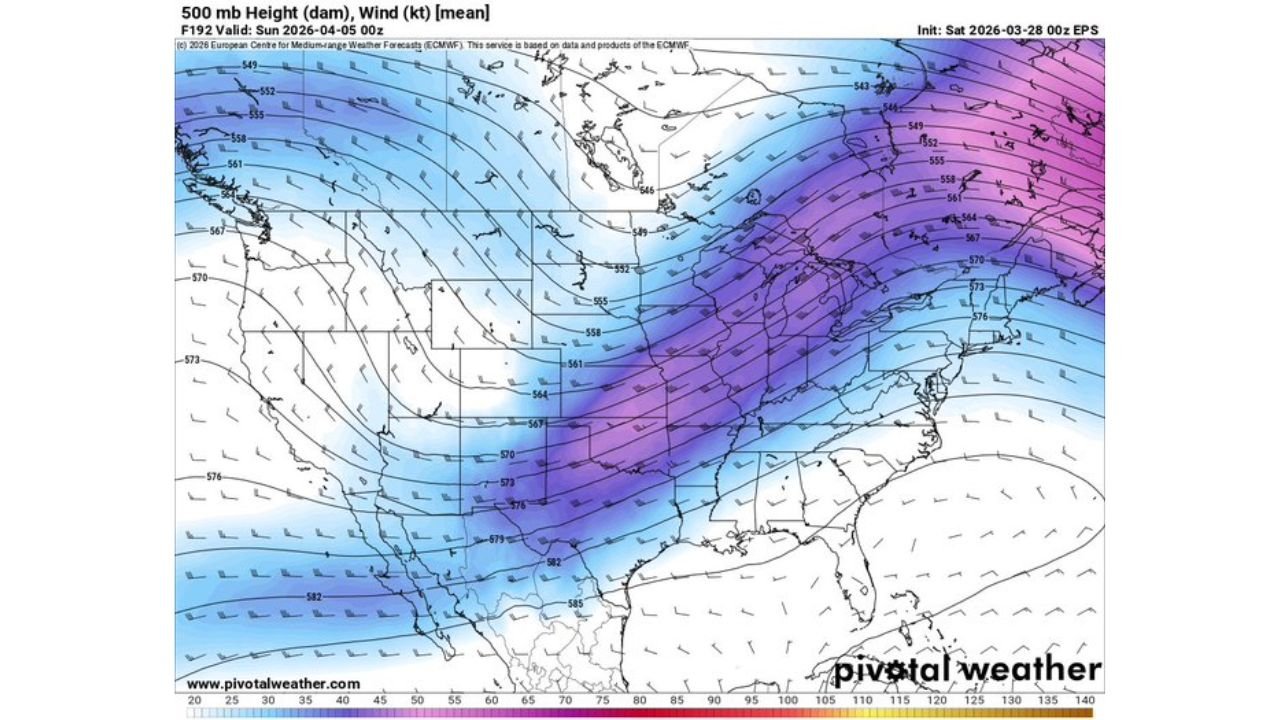
ECMWF EPS Ensemble Mean — The Middle Ground Solution
The ECMWF EPS ensemble mean, also initialized 00z March 28 and valid at the same time, shows a slightly less progressive solution than the AIFS. The trough axis on this map is positioned a bit further west compared to the AIFS, with the strongest upper-level energy still pushing across the central and eastern U.S. but not as far advanced.
The key difference on this map is the trough positioning across the southern Plains and lower Mississippi Valley — the height contours suggest more residual energy remains across this zone compared to the AIFS solution. If this solution verifies, severe weather potential on April 5th would be more focused across the Mid-South and Tennessee Valley corridor.
GEFS Ensemble Mean — The Most Amplified Solution
The GFS Ensemble Mean, initialized 06z March 28 and valid at the same April 5th timeframe, is showing the most amplified trough pattern of the three. On this map, the 500 mb trough is digging further south and maintaining a more favorable position for severe weather development across the central U.S. compared to either ECMWF solution.
The GEFS solution keeps stronger upper-level energy across the southern Plains and lower Mississippi Valley into April 5th — a pattern that would be more supportive of an active severe weather day across Texas, Oklahoma, Arkansas and potentially Missouri on Sunday if this solution verifies.
Why the Model Spread Matters So Much Right Now
Here is the honest bottom line on this April 5th data. The models are all over the place — and at 8 days out from a potential severe weather event, that level of disagreement is actually expected. What it means in practical terms is this:
The existence of a significant energy trough moving across the United States around April 5th is not in question. All three models agree on that. What they disagree on is how fast that trough moves, how far south it digs and exactly where the severe weather corridor sets up as a result of those differences.
A trough that moves too fast — like the AIFS is suggesting — shifts the severe weather window earlier and further northeast. A trough that digs deeper and slows down — closer to what the GEFS is showing — keeps the severe weather potential alive across the southern Plains and lower Mississippi Valley into April 5th itself.
The region most at risk will not be clearly identifiable until the models come into much better agreement — likely within the next 48 to 72 hours as the pattern comes into shorter-range resolution.
Three-Model Comparison for April 5th Setup
| Model | Trough Position | Energy Speed | Likely Severe Zone | Confidence |
|---|---|---|---|---|
| ECMWF AIFS Ensemble | Most Progressive | Fast | Ohio Valley / Great Lakes | 🟡 Low |
| ECMWF EPS Ensemble | Moderate | Moderate | Mid-South / Tennessee Valley | 🟡 Low |
| GEFS Ensemble | Most Amplified | Slower | Southern Plains / Lower MS Valley | 🟡 Low |
| Model Agreement | ❌ Poor | ❌ Significant Spread | Undefined at this range | 🔴 Very Low |
| Overall Confidence | April 5 Severe Possible | Somewhere in Central U.S. | TBD as models converge | 🔴 Very Low |
What States Should Be Watching Right Now
Given the model spread, no single state can be confidently identified as the primary target for April 5th severe weather at this time. However, the broad envelope of possibilities across all three model solutions covers a significant geographic area.
🟡 Texas and Oklahoma — Inside the severe weather envelope if the GEFS amplified solution verifies. The southern Plains severe weather window on April 5th depends entirely on how slowly and how far south the trough digs. Watch this space closely over the next 72 hours.
🟡 Arkansas, Missouri and Tennessee — The middle-ground solution from the ECMWF EPS points toward this corridor as a potential severe weather zone on April 5th. The Mid-South and Tennessee Valley are inside the range of outcomes across at least one of the three model solutions.
🟡 Illinois, Indiana and Ohio — If the most progressive ECMWF AIFS solution verifies, the energy arrives over this corridor by April 5th. Severe weather possible here depending on the exact trough timing and available instability.
🔵 The Pacific Coast and Mountain West — Well upstream of the trough at this valid time. No severe weather threat from this pattern for the western states on April 5th.
When to Expect Clarity on This Setup
Check back Monday and Tuesday. The next 48 hours of model runs — particularly the ECMWF and GFS 00z and 12z cycles — will be the most telling in terms of whether the models begin converging on a single solution or continue to show the current spread.
If the models converge toward the amplified GEFS solution, the southern Plains severe weather community should elevate their preparations for April 5th. If convergence trends toward the progressive AIFS solution, the focus shifts to the Ohio Valley and the window for Plains severe weather narrows significantly.
This is a forecast that rewards daily monitoring. The answer is coming — it just is not fully here yet.
Data Sources: ECMWF AIFS Ensemble Mean 500 mb — Initialized 00z March 28, 2026, Valid 00z April 5, 2026 | ECMWF EPS Ensemble Mean 500 mb — Initialized 00z March 28, 2026, Valid 00z April 5, 2026 | GEFS Ensemble Mean 500 mb — Initialized 06z March 28, 2026, Valid 00z April 5, 2026
The First Week of April Is Shaping Up to Be One of the Most Active Severe Weather Periods of the Spring Season
Multiple setups, multiple states, multiple days of risk — and the models are still working out the details. Stay informed at ChicagoMusicGuide.com — your source for daily upper-level pattern analysis, severe weather setup tracking and storm coverage across the central United States.