
The United States Has Already Seen 2,002 Severe Thunderstorm Warnings in Just the First 87 Days of 2026 and the Most Active Storm Season Is Still Ahead
ATLANTA, GA — The severe weather season is not coming. It is already here — and it has been here since January. A stunning visualization of every Severe Thunderstorm Warning issued across the United States from January 1 through March 27, 2026 reveals something that should put every resident from Texas to New York on notice: 2,002 warnings have already been issued before spring has even officially taken hold. The map of those warnings looks less like a weather chart and more like a roadmap of chaos blanketing the eastern half of the country.
What 2,002 Warnings in 87 Days Actually Means
To understand why this number matters, it helps to know what a Severe Thunderstorm Warning actually is and what it takes to get one issued.
The National Weather Service issues a Severe Thunderstorm Warning when a thunderstorm is capable of producing wind gusts of 58 mph or greater, hail of 1 inch in diameter or larger — roughly quarter-sized — or a tornado. These are not routine weather alerts. Each one of these 2,002 warnings represents a storm that was actively threatening life and property somewhere in the United States at the moment it was issued.
The U.S. averages between 30,000 and 40,000 Severe Thunderstorm Warnings per year in a typical season. With 2,002 already on the books by March 27th, 2026 is running at a pace that puts it squarely on track for an average to above-average year — and the critical point is this: the most active months for severe weather have not even arrived yet.
April, May and June are historically the peak months for severe thunderstorm activity across the United States. The 2,002 warnings issued so far represent what the atmosphere produces in the quieter months of winter and early spring. What happens when the full fury of severe season arrives across the Plains, Midwest and Southeast is still ahead.
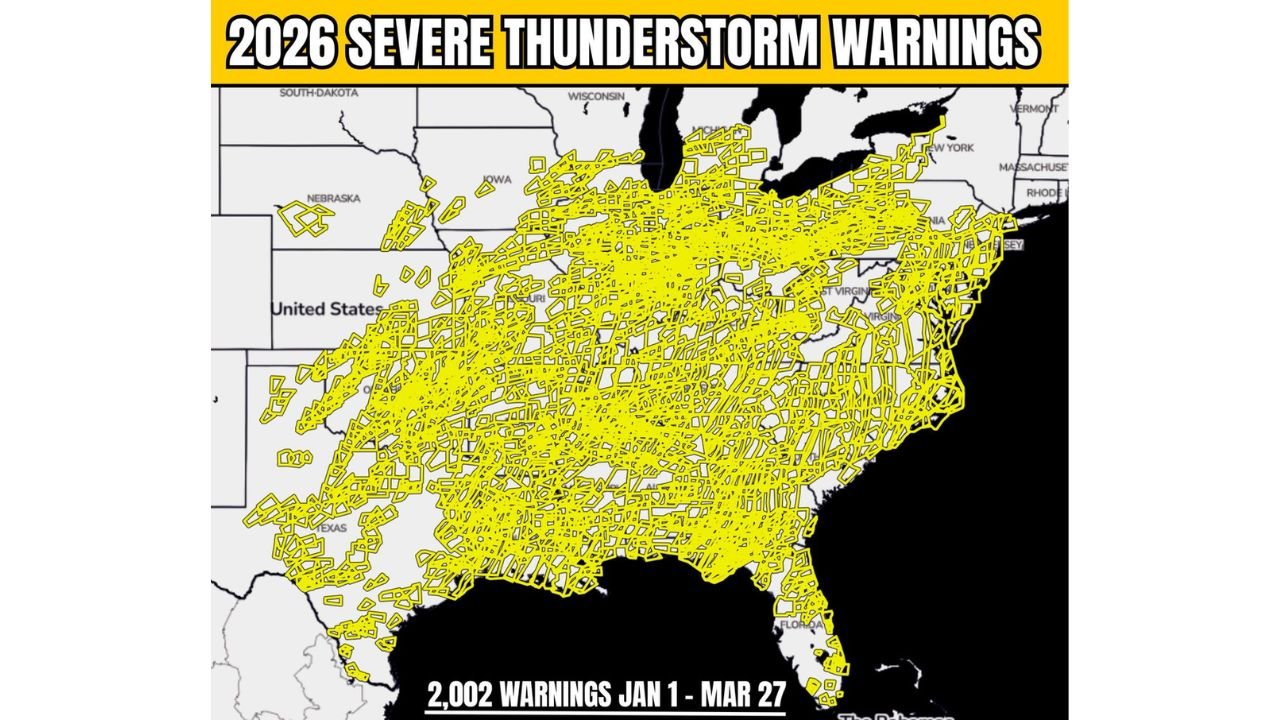
The Map That Tells the Real Story
The warning footprint map for January 1 through March 27, 2026 is one of the most striking pieces of severe weather data to come out of this early season. Every yellow polygon on the map represents the area covered by a single Severe Thunderstorm Warning — and when you plot all 2,002 of them together, the result is a dense, overlapping blanket of yellow covering virtually the entire eastern United States.
The geographic concentration of warnings by region:
The Southeast — from Texas and Arkansas east through Mississippi, Alabama, Georgia and into the Carolinas and Florida — shows the densest concentration of warning polygons. This region consistently generates the most winter and early spring severe weather activity due to its proximity to Gulf moisture and frequent frontal passages from October through April.
The Ohio Valley and Mid-Atlantic corridor — covering Tennessee, Kentucky, West Virginia, Virginia, Pennsylvania and into New Jersey and New York — shows a second dense concentration of overlapping warning boxes. This region does not get the attention that the Plains does for severe weather but the 2026 map makes clear that it has been an extremely active winter for this part of the country.
The Midwest and Great Lakes — Illinois, Indiana, Michigan and Ohio — show a meaningful cluster of warnings concentrated along the southern Great Lakes corridor. Given that severe thunderstorms in this region are far less common in January and February than in May and June, the presence of this many warning polygons this early in the year stands out.
The Plains states — Kansas, Oklahoma and Missouri — show scattered warning activity. This is actually consistent with climatology for early season, as the southern Plains typically does not reach peak severe weather activity until April and May when atmospheric moisture and instability are fully established.
2026 Severe Thunderstorm Warning Data Table
| Metric | 2026 Value | Historical Average | Status |
|---|---|---|---|
| Total Warnings Jan 1 – Mar 27 | 2,002 | Approx. 1,500–2,000 | 🟠 Average to Above |
| Annual U.S. Average | 30,000–40,000 | 30,000–40,000 | 🟡 On Pace |
| Peak Season Remaining | April, May, June | Historically busiest | ⚠️ Most Active Ahead |
| Most Impacted Region | Southeast, Ohio Valley | Southeast typical | 🔴 High Activity |
| Days Covered | 87 days | — | ✅ Jan 1 – Mar 27 |
State-by-State Activity Reading From the Map
🔴 Texas, Arkansas, Louisiana, Mississippi — Among the most warning-dense states on the entire map for the January through March window. The Gulf Coast corridor has been extremely active during what is typically considered the off-season for much of the country.
🔴 Alabama, Georgia, Tennessee, Kentucky — Dense warning coverage visible across the entire footprint of these states. The Tennessee Valley and Deep South corridor has seen repeated rounds of severe weather since the start of 2026.
🟠 Virginia, West Virginia, Pennsylvania, New Jersey, New York — A surprisingly active early season for the Mid-Atlantic states. Warning polygons stretch well into the Northeast — a reminder that severe weather is not exclusively a Plains and Southeast phenomenon.
🟠 Illinois, Indiana, Ohio, Michigan — Great Lakes states showing meaningful warning activity for January through March. This activity will escalate dramatically as the atmosphere warms heading into April and May.
🟡 Kansas, Nebraska, Missouri — Lighter warning coverage in the Plains states so far — consistent with climatology for this time of year. This is the region to watch most closely as April arrives and the peak severe season opens.
🟢 Northern Plains and Mountain West — Minimal severe thunderstorm warning activity on the map. Montana, Wyoming, Idaho, Colorado and the Pacific Northwest rarely see significant severe thunderstorm activity in winter and early spring.
Why This Number Should Have Your Attention Heading Into April
2,002 warnings before April 1st is not just a statistic. It is a signal about the state of the atmosphere in 2026. A warmer-than-normal winter across much of the eastern United States — documented by the more than 1,100 daily temperature records broken in March alone — has kept the Gulf moisture supply unusually active and the frontal boundaries that trigger severe weather unusually frequent through the cold season.
As temperatures continue rising and the jet stream pattern evolves into the classic spring configuration, the ingredients for severe weather will become more abundant, not less. The 2,002 warnings issued in 87 days are the opening act. The next 90 days will write the main chapter of the 2026 severe weather season across the United States.
Severe Thunderstorm Season Is Already Running Hot in 2026 and the Peak Months Are Just Getting Started
More warnings, more storms and more active weather patterns are directly ahead. Stay informed at ChicagoMusicGuide.com — your source for severe thunderstorm tracking, warning data and storm coverage across the Southeast, Midwest, Great Lakes and the entire United States.