
The United States Is Experiencing One of Its Most Severe Drought Situations in Recent Memory With Extreme Conditions Now Blanketing Texas, Oklahoma, Colorado and California as Farmers and Ranchers Face a Crisis Heading Into Spring
DALLAS, TX — The drought map released by the Climate Prediction Center on March 30, 2026 is one of the most alarming drought pictures the continental United States has seen in years — and the meteorologist who analyzed it put it plainly: conditions this severe are difficult to recall in recent memory. From the Pacific Coast to the Gulf of Mexico, from the northern Plains to the Deep South, virtually no part of the country is drought-free right now. The red and dark red extreme drought zones covering Texas, Oklahoma, Colorado, New Mexico, California and Florida represent a water supply crisis that is already impacting agriculture, communities and ecosystems across a vast portion of the nation — and for farmers and ranchers staring down planting season, the timing could not be worse.
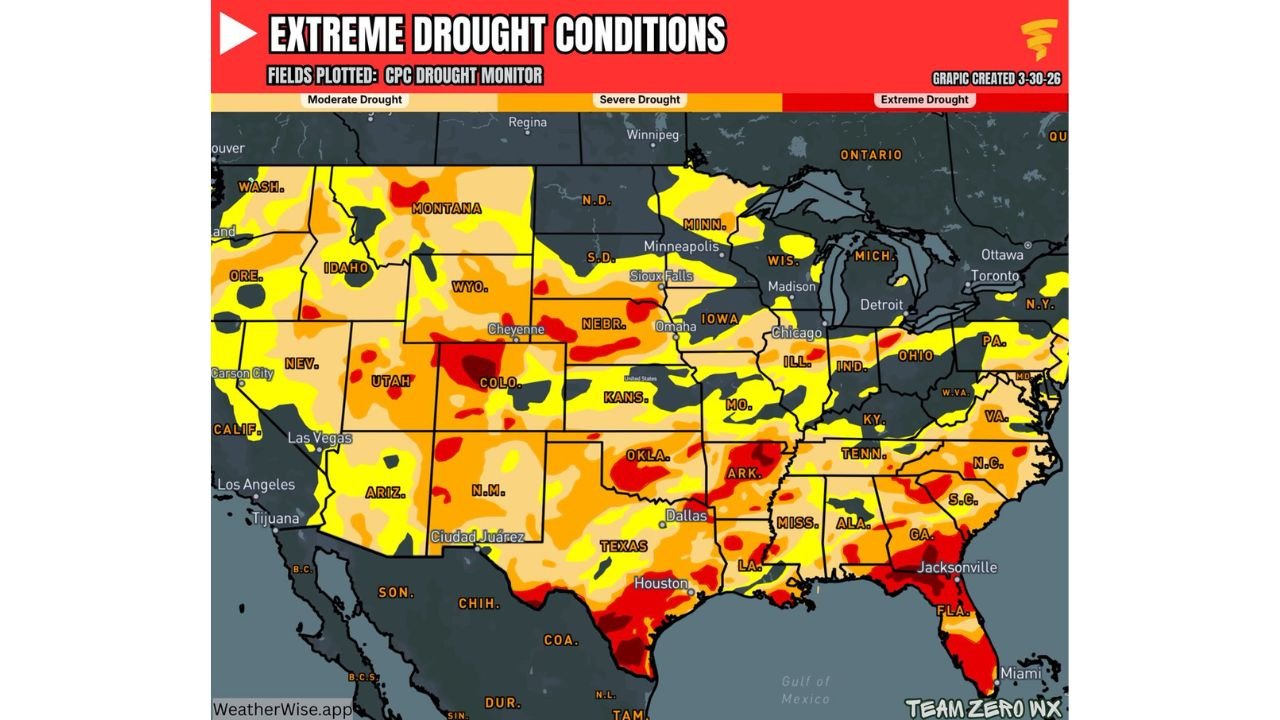
What the Drought Map Is Actually Showing
The CPC Drought Monitor map, created March 30, 2026, uses a color scale from yellow through orange to red to dark red — representing Moderate Drought, Severe Drought and Extreme Drought conditions respectively. The geographic coverage of each category on this map is extraordinary.
Yellow — Moderate Drought covers the broadest area on the map and essentially acts as a baseline across most of the country. States from the Pacific Northwest through the northern Plains and across much of the Midwest and East are showing at minimum moderate drought conditions.
Orange — Severe Drought covers a massive swath of the central and western United States, including much of Kansas, Nebraska, Wyoming, Idaho, Oregon and significant portions of the Midwest. Severe drought means soil moisture deficits are significant enough to cause crop stress, reduce streamflows and begin impacting water supplies.
Red and Dark Red — Extreme Drought is where the map becomes truly alarming. The deepest red on the map — indicating the most severe drought conditions in the entire classification system — is concentrated across several specific areas:
Texas — The state is almost entirely covered in orange to dark red. The Dallas corridor, Houston area, the Hill Country and west Texas all show extreme drought conditions. For a state that is simultaneously facing severe thunderstorm threats this week, the drought-to-flood whiplash that Texas regularly experiences is on full display.
Oklahoma — Extreme drought conditions extend across most of the state. Combined with the severe weather outbreak this week, Oklahoma is experiencing the classic spring Plains pattern of desperately needed rain arriving in the form of damaging storms.
Colorado — Extreme and severe drought covers virtually the entire state. Combined with the 0th percentile snowpack recorded across the Upper Colorado Basin just days ago, Colorado is facing a compound water supply crisis heading into the critical spring melt season.
New Mexico and Arizona — Deep red extreme drought conditions dominate both states. The Southwest drought that has been building through the winter is showing no meaningful relief on this map.
California — Despite a wet winter in some years, the current map shows widespread severe to extreme drought returning across much of the state — from the Central Valley through Southern California and into the northern portions of the state.
Florida — A notable red zone across portions of Florida stands out given the state’s reputation for humidity. Extreme drought conditions in Florida heading into spring have direct implications for wildfire risk across the state’s pine flatwoods and scrub ecosystems.
Why This Drought Map Looks Different From Recent Years
The meteorologist who analyzed this map made a specific and striking observation — conditions this severe across this large an area are difficult to recall in recent memory. To understand why, consider what a normal drought map looks like versus what is being shown here.
In a typical spring, the drought map for the continental United States shows a patchwork of conditions — some areas dry, some areas wet, with the overall pattern creating a mosaic of drought and non-drought zones. What the March 30, 2026 map shows instead is something close to a coast-to-coast drought blanket where finding a drought-free zone requires looking at the gray areas that represent only a small fraction of the country’s total area.
The cause traces directly back to the March 2026 heat wave that shattered more than 1,100 daily temperature records across the country and accelerated soil moisture evaporation at a critical time of year when winter soil moisture reserves are typically being maintained. Combined with below-normal snowpack across the western mountains — particularly the 0th percentile snowpack in the Upper Colorado Basin — the drought conditions being mapped now reflect both the lack of winter precipitation and the extraordinary warmth that rapidly evaporated what moisture did exist.
Drought Severity Table by Region
| Region | Drought Category | States Most Impacted | Agriculture Impact |
|---|---|---|---|
| South Texas, Gulf Coast | 🔴 Extreme | TX, LA | Severe crop stress, pasture loss |
| Southern Plains | 🔴 Extreme to Severe | OK, KS, NM | Winter wheat at risk |
| Southwest | 🔴 Extreme | AZ, NM, S. CA | Water supply critical |
| Colorado and Rockies | 🔴 Extreme | CO, UT | Snowpack failure, river risk |
| Northern Plains | 🟠 Severe to Moderate | NE, WY, SD, ND | Soil moisture deficits |
| Midwest | 🟡 Moderate to Severe | IA, IL, MO, IN | Subsoil moisture depleted |
| Southeast | 🟠 Severe | FL, GA, AL | Wildfire risk elevated |
| Pacific Northwest | 🟠 Severe to Moderate | WA, OR, ID | Streamflow below normal |
| Northeast | 🟡 Moderate | NY, PA, NE states | Less severe than rest of country |
State-by-State Drought Impact
🔴 Texas — The hardest-hit large state on the entire map. Virtually the entire state from the Panhandle to the Gulf Coast shows orange to dark red drought conditions. Winter wheat across the Texas Panhandle and Rolling Plains is under severe stress, and pasture conditions for cattle operations across west and central Texas are being described as poor to very poor across most reporting districts.
🔴 Oklahoma — Extreme drought extending statewide. The combination of drought conditions and this week’s severe storm threat is the classic Oklahoma spring scenario — the state desperately needs rain but the rain it gets often arrives in the form of damaging storms rather than the slow, soaking events that effectively recharge soil moisture.
🔴 Colorado — Extreme drought combined with the 0th percentile snowpack in the Upper Colorado Basin creates a compound crisis. Rivers fed by snowmelt — including the Colorado River itself — are expected to see near-record low spring runoff, threatening water supplies for millions across the state and downstream.
🔴 California — Widespread severe to extreme drought returning across much of the state. The Central Valley agricultural corridor — which produces a significant portion of the nation’s fruits, vegetables and nuts — is showing moderate to severe drought conditions that will impact irrigation water availability through the spring and summer growing season.
🔴 Florida — The extreme drought zone across portions of Florida stands out as an underappreciated risk on this map. Wildfire season in Florida typically begins in spring — and extreme drought conditions heading into April create the fuel moisture deficits that make Florida wildfires particularly dangerous and fast-moving.
🟠 Kansas and Nebraska — Severe drought conditions across the central Plains states. Kansas winter wheat — one of the most important crops in the nation’s breadbasket — is experiencing significant stress at a critical stage of development heading into spring green-up.
🟠 Pacific Northwest — Oregon and Washington — Severe drought conditions across much of both states, compounded by the below-normal snowpack in the Cascades that will limit water supply for agricultural irrigation through the summer months.
🟡 Midwest — Iowa, Illinois, Indiana, Missouri — Moderate to locally severe drought conditions. Subsoil moisture reserves across the Corn Belt are below normal heading into the critical spring planting window, which means the heavy rainfall forecast for this week — while potentially causing flooding in vulnerable areas — is ultimately providing necessary drought relief for the region’s agricultural sector.
The Early April Pattern Change: Some Relief Coming
There is one piece of positive news embedded in this otherwise alarming drought picture. A pattern shift heading into early April is expected to begin delivering some drought relief across portions of the central and eastern United States. The heavy rainfall already forecast through April 5th across Missouri, Illinois, Indiana and Ohio represents exactly the kind of soaking precipitation that begins to recharge soil moisture deficits in those states.
However, drought relief is a slow process. A single week of heavy rainfall does not erase months of moisture deficit — particularly across the Deep South and Great Plains where extreme drought conditions have been building since late fall. For Texas, Oklahoma and the Southwest, the April pattern change offers only limited and inconsistent relief — not the kind of sustained wet pattern that reverses extreme drought conditions.
The agricultural impact of this drought will be felt through the 2026 growing season regardless of what happens in April — soil moisture deficits at planting time directly impact crop yields, and those deficits were still extreme as of March 30th.
One of the Most Widespread Drought Situations in Recent History Is Now Covering the Continental United States
The drought is real, it is severe and it is affecting agriculture, water supplies and communities from coast to coast. Stay informed at ChicagoMusicGuide.com — your source for drought monitor updates, agricultural weather impacts and climate analysis across Texas, Oklahoma, Colorado, California and the entire United States.