Florida Faces a Stormier and Wetter Fall and Winter Ahead as a Strong El Niño Rapidly Builds With Historical Data Showing Tornado and Flood Events Skyrocket During Strong El Niño Years Across the Sunshine State
MIAMI, FL — A major climate shift is quietly accelerating in the Pacific Ocean — and Florida is going to feel it more than almost any other state in the country. The latest official NOAA data is showing a rapid transition toward El Niño conditions, with probabilities climbing steeply through the summer and fall of 2026. If the current trend holds and a Strong El Niño develops as the data suggests, Florida residents need to understand what that means — because the historical record is not subtle about the consequences. Tornadoes spike. Floods surge. Severe weather becomes a near-constant threat from November through April. This is not a distant concern. The data says it is already building.
What El Niño Is and Why Strong Matters
Before diving into the Florida-specific numbers, it helps to understand exactly what El Niño is and why the word “Strong” changes everything about the forecast.
El Niño is a periodic warming of the central and eastern Pacific Ocean that fundamentally alters weather patterns across the entire planet. In the United States, El Niño conditions push the jet stream further south than normal — especially during fall and winter. That southward-displaced jet stream acts like a highway for storm systems, routing them directly across the Gulf of Mexico and into the southeastern United States.
The stronger the El Niño, the further south that jet stream pushes — and the more active the storm pattern becomes for Florida and the Gulf Coast states.
The official NOAA Climate Prediction Center ENSO probability chart, issued March 2026, tells a striking story about where conditions are heading. La Niña probabilities — shown in blue — are already fading rapidly. By the May-June-July window, El Niño probability has climbed to approximately 45%. By July-August-September, that number reaches 62%. By August-September-October, El Niño probability is at 72%. And by the October-November-December and November-December-January windows — the heart of Florida’s severe weather season — El Niño probability is running at 80% and above.
That is an 80%+ chance of El Niño conditions during the exact months when a strong El Niño is most damaging for Florida.
What a Strong El Niño Does to Florida’s Tornado Numbers
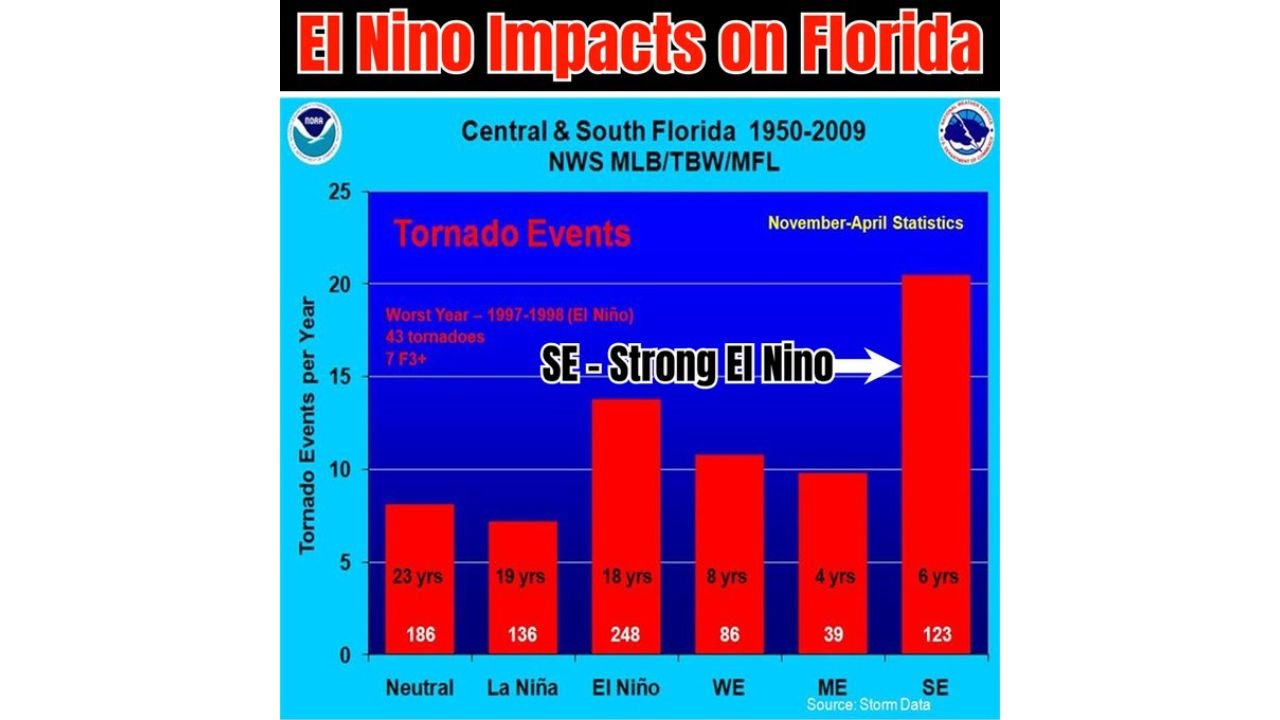
The historical record on this subject is one of the most compelling datasets in American meteorological history — and it comes directly from NWS data covering Central and South Florida from 1950 through 2009 across the Melbourne, Tampa Bay and Miami forecast offices.
The tornado events per year chart breaks down Florida tornado activity by ENSO phase — and the numbers tell a dramatic story:
- Neutral years (23 years of data): Average of 8.1 tornado events per year — 186 total tornadoes across 23 years
- La Niña years (19 years of data): Average of 7.2 tornado events per year — 136 total across 19 years
- El Niño years (18 years of data): Average of 13.8 tornado events per year — 248 total across 18 years
- Weak El Niño (8 years): Average of 10.8 events per year
- Moderate El Niño (4 years): Average of 9.8 events per year
- Strong El Niño — SE (6 years): Average of 20.5 tornado events per year — 123 tornadoes in just 6 years
That last number is the one that demands attention. Strong El Niño years produce an average of 20.5 tornado events per year across Central and South Florida — more than double the neutral year average and nearly three times the La Niña baseline. The worst single year in the entire dataset was 1997-1998 during a Strong El Niño — 43 tornadoes, including 7 rated F3 or stronger.
What a Strong El Niño Does to Florida’s Flood Numbers
The flood data is equally striking. The Florida River Flood Events per Year chart comparing ENSO phases shows an even more dramatic separation between Strong El Niño and every other climate pattern.
Flood events per year by ENSO phase:
- Strong El Niño (SE): 23.2 flood events per year — the highest of any category by a massive margin
- Moderate El Niño (ME): 10.5 events per year
- Weak El Niño (WE): 4.7 events per year
- Neutral (N): 5.0 events per year
- Weak La Niña (WL): 2.4 events per year
- Moderate La Niña (ML): Near zero
- Strong La Niña (SL): 5.7 events per year
Strong El Niño years produce more than double the flood events of any other climate phase for Florida. The jump from Moderate El Niño at 10.5 events to Strong El Niño at 23.2 events is not a gradual increase — it is a step change that reflects how dramatically the atmosphere responds when Pacific Ocean warming reaches the Strong threshold.
El Niño and Hurricane Season: The One Silver Lining
There is one area where a Strong El Niño actually works in Florida’s favor — and it is worth understanding clearly.
Strong El Niño conditions increase vertical wind shear across the Atlantic basin during hurricane season. Wind shear is the change in wind speed and direction with altitude — and strong shear is the enemy of hurricane development and intensification. When the jet stream is displaced southward by El Niño, the shear across the Caribbean and Gulf of Mexico increases significantly, which disrupts hurricane formation and limits the number of storms that reach major hurricane status.
The graphic showing El Niño hurricane season impacts makes this clear — the eastern Pacific becomes more active due to less vertical wind shear, while the Atlantic basin sees fewer hurricanes due to stronger shear and greater atmospheric stability.
However — fewer Atlantic hurricanes does not mean zero impact for Florida. Historical Strong El Niño seasons have still produced storm impacts across Florida even with reduced overall basin activity. The risk does not disappear. It simply shifts in character from a high-volume hurricane threat to a lower-frequency but still real landfalling storm risk.
El Niño Impact Comparison Table for Florida
| Category | Neutral Year Avg | Strong El Niño Avg | Increase |
|---|---|---|---|
| Tornado Events Per Year | 8.1 | 20.5 | 🔴 +153% |
| River Flood Events Per Year | 5.0 | 23.2 | 🔴 +364% |
| Hurricane Season Activity | Average | Below Average | 🟢 Reduced |
| Winter Severe Weather | Moderate | Very High | 🔴 Significantly Elevated |
| El Niño Probability by ASO 2026 | — | 72% | ⚠️ High and Rising |
What Florida Residents Need to Do With This Information Right Now
The NOAA probability data is showing El Niño at 80%+ confidence for the October through January window — the exact period when a strong El Niño’s jet stream impacts are most severe for Florida. That means the planning window for Florida residents is not next fall. It is right now.
For homeowners: Review flood insurance coverage before fall. Strong El Niño years produce more than 23 river flood events annually in Florida — properties that have never flooded before have flooded during past Strong El Niño winters.
For communities across Central and South Florida: The tornado record from 1997-1998 — 43 tornadoes including 7 rated F3 or stronger — happened during the last comparable Strong El Niño. That is a season that overwhelmed local emergency management systems and produced damage across a wide swath of the state. Severe weather preparedness needs to begin before November, not after the first tornado warning of the season.
For the entire state: The combination of elevated tornado frequency, dramatically increased flood events and a still-present hurricane threat creates a multi-hazard risk environment for Florida in the fall and winter of 2026 that has not been seen since the last major El Niño cycle.
State-by-State Florida Regional Impact
🔴 Central Florida — Orlando, Tampa, Lakeland corridor — Historically the most active zone for El Niño-driven tornado events across the state. The NWS data covers this exact region and the numbers are starkest here. Central Florida residents face the highest combined tornado and flood risk of any part of the state during Strong El Niño winters.
🔴 South Florida — Miami, Fort Lauderdale, West Palm Beach — Also covered by the NWS historical dataset. Tornado and flood activity both spike significantly during Strong El Niño years for the South Florida peninsula. The combination of elevated moisture, the active jet stream and Florida’s flat terrain makes flood risk particularly acute.
🟠 North Florida — Jacksonville, Tallahassee, Pensacola — On the northern fringe of the most active El Niño impact zone. Severe weather frequency increases but slightly less dramatically than Central and South Florida. The Panhandle faces enhanced winter storm and flood risk.
🟢 Hurricane threat — Statewide — Reduced compared to neutral or La Niña years due to increased Atlantic wind shear. But not zero — historical Strong El Niño seasons have still produced Florida hurricane impacts.
Florida’s Most Active Storm Season in Years Could Be Just Months Away
Strong El Niño conditions are building fast and the historical record shows exactly what that means for the Sunshine State. Stay informed at ChicagoMusicGuide.com — your source for El Niño impact analysis, Florida severe weather tracking and climate outlook coverage across Florida and the entire United States.