
Storm Prediction Center Overhauls Tornado Outlook Maps, Introducing New Conditional Intensity Groups for High-Risk Events
UNITED STATES — The Storm Prediction Center (SPC) is preparing to roll out major updates to its convective outlook graphics, including a redesigned tornado probability map and the introduction of new Conditional Intensity Groups aimed at improving how severe weather threats are communicated.
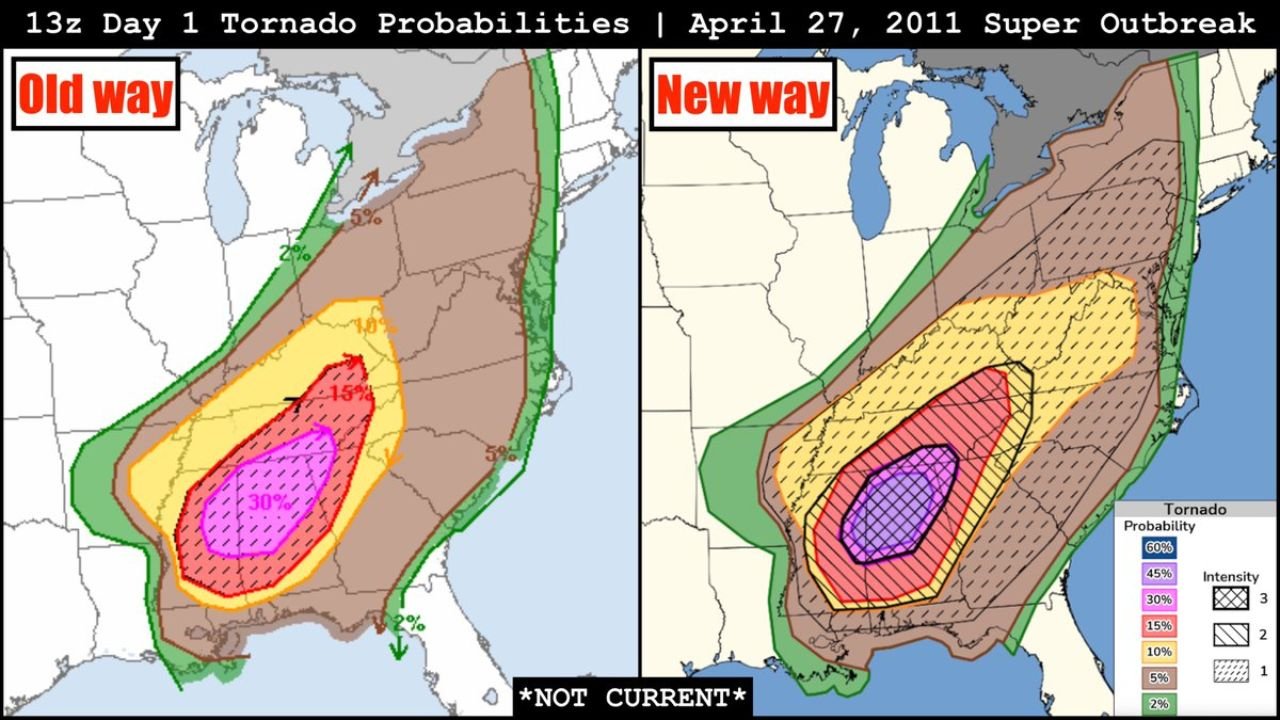
A newly released preview comparing the “Old Way” and “New Way” tornado outlook formats — using the April 27, 2011 Super Outbreak as a historical example — shows significant structural changes in how high-end tornado risk is displayed.
The example shown is not a current forecast.
What’s Changing in the Tornado Outlook
Previously, SPC Day 1 tornado probability maps highlighted percentage contours such as:
- 2%
- 5%
- 10%
- 15%
- 30%
The older format primarily focused on raw tornado probability percentages across a broad risk zone extending from the Gulf Coast through the Ohio Valley and into the Northeast.
The new format retains probability shading but introduces Conditional Intensity Groups, which add another layer of context by signaling the potential strength of tornadoes within a given probability area.
Understanding Conditional Intensity Groups
Under the new design, hatched overlays help indicate areas where stronger tornadoes (EF2+) are more likely if storms develop as expected.
This change allows forecasters to communicate not just how many tornadoes could occur, but also:
- The potential intensity
- The conditional nature of the threat
- The likelihood of significant impacts
In the April 27, 2011 example, the high-risk corridor stretching from Mississippi and Alabama through Tennessee and into Kentucky and Ohio appears more clearly defined under the new format.
Why the Update Was Needed
SPC officials indicate the updates were designed to:
- Improve clarity for emergency managers
- Reduce confusion about hatched risk areas
- Better differentiate between widespread lower-end threats and concentrated high-impact zones
- Modernize visual communication of extreme weather risk
The 2011 Super Outbreak example demonstrates how overlapping probability and intensity signals can better illustrate high-end outbreaks.
How This Affects Midwest and Illinois Forecasts
For states like Illinois, Indiana, Missouri, and Kentucky, which frequently fall within severe weather corridors, the new graphics could provide clearer signals when:
- Tornado potential is conditional but high-impact
- A strong tornado threat exists within a broader severe weather zone
- Significant outbreaks are possible
For Chicago and surrounding Midwest communities, clearer communication may help emergency planners and the public better interpret evolving threats during spring and summer severe weather seasons.
Video Explanation Coming Soon
A detailed breakdown video explaining the changes — including why they were implemented and what each new group means — is expected to be released soon following final approvals.
The upcoming presentation will dive deeper into the reasoning behind the update and how to read the new maps effectively.
As severe weather season approaches, these updates could reshape how tornado risk is communicated nationwide.
For continued coverage on national severe weather trends and Midwest storm outlooks, visit ChicagoMusicGuide.com.